Thursday, 6 February 2014

Objectives of the study

An Ethiopian boy blinded by Vitamin A deficiency


To reduce the prevalence of Vitamin A deficiency in developing countries such as Zimbabwe in Africa, scientists have developed a strain of yellow maize with exceptionally high β-carotene content and bioavailability, through genetic modification. This biofortified cultivar was then cross-bred with a locally-cultivated variety of yellow maize, to yield a hybrid strain of yellow maize (YM) that contains high β-carotene content and bioavailability, yet retaining the flavour of local maize, so that it appeals to locals' palate.


The aim of this study was to determine the conversion factor of β-carotene in this biofortified strain of YM to retinol (Vitamin A). How much of this biofortified YM should we eat to obtain 1 milligram (mg) of retinol?

A low conversion factor indicates that we need eat only a little of it to obtain sufficient Vitamin A. This is especially helpful in developing countries where many households do not have a lot of money to spend for groceries.

 
Biofortified crops help reduce deficiency diseases especially in developing nations


Wednesday, 5 February 2014

Overview of the study


This study makes use of the stable isotope tracer technique.

1) Seeds from the biofortified strain of YM were first cultivated in deuterated heavy water (2H2O) so that the β-carotene produced will also be deuterated (2H-BC) - having deuterium atoms in them.

2) When subjects consume this maize, 2H-BC will be converted correspondingly into 2H-retinol in their bodies.
  
3) As 2H-retinol and 2H-BC are both heavier than their unlabelled counterparts, they can be traced and collected from the blood samples of the subjects.

4) Conversion factor is calculated by comparing the amount of 2H-BC consumed and the amount of 2H-retinol found in the blood.


Production of intrinsically-labelled yellow maize 

The biofortified strain of YM (DEexp × CI7) was grown hydroponically in a special nutrient solution containing minerals and deuterated heavy water (2H2O). After about 45 days, the matured maize ears were collected, dried and the maize kernels were removed.

Hydroponics is the technique of growing plants in mineral solutions instead of soil.


Production of intrinsically-labelled yellow maize dose 

In total, 874 g of the YM kernels were collected and ground into YM flour. About 145 g were used in High Performance Liquid Chromatography (HPLC) analysis to determine the concentration of the various carotenoids within (lutein, zeaxanthin, β-cryptoxanthin, β-carotene) before and after cooking. [Table 1 and Fig.2].

The remaining 729 g of YM flour  was cooked together with water into sadza, traditional Zimbabwean yellow maize thick porridge. Together, 2401 g of sadza was prepared.

Zimbabwean white maize sadza


Volunteers and study design

8 Zimbabwean men (mix of ethnicities) aged between 40 and 70, non-smoking and who have not been taking any Vitamin A or β-carotene supplements in the past month, volunteered to participate in the study.

The 8 men were instructed to abstain from Vitamin A or β-carotene rich foods for 2 weeks before the study. On day #1 of the study, 10mL of blood was drawn from each subject. They were then fed according to Table A. 

10mL of blood was then drawn 3,6,9,11 and 13 hours after the biofortified YM sadza dose and also on days #2,3,4,5,6 and 7. Everyday, low Vitamin A or β-carotene meals were offered to the subjects.

On day #8 of the study, 10mL of blood was again drawn from each subject. This time, the subjects were fed according to Table B.


10mL of blood was then drawn 3,6,9,11 and 13 hours after the 13C10 retinyl acetate dose and also on days #9, 10, 11, 13,15,19,22,29 and 36. Everyday, low Vitamin A or β-carotene meals were offered to the subjects.


An external file that holds a picture, illustration, etc.
Object name is ajcn9420510fig1.jpg
Study design


***13C10 retinyl acetate served as a positive control for this study. Once in circulation,13C10 retinyl acetate would be converted to 13C10 retinol. If 13C10 retinol is found in the subjects' blood samples, this means that the body is indeed producing retinol normally, and that any 2H-retinol present would have been derived from 2H-BC itself. 


300g dose biofortified yellow maize sadza
20g butter
0.5g corn oil
= ~1.2mg β-carotene
Table A


300g dose white maize sadza
20g butter
1mg 13C10-retinyl acetate
0.5g corn oil
Table B


Tuesday, 4 February 2014

Reverse Phase - High Performance Liquid Chromatography (RP-HPLC)

RP-HPLC was used to:

- determine the total amount of β-carotenes (2H-BC + non-2H-BC) and retinols (endogenous retinols + 13C10-retinols + 2H-retinols) circulating in the total serum of the subjects.

 
Set-up of Reverse-Phase HPLC


2mL of chloroform, 1mL of methanol and 2mL of hexane were added to a 100uL serum sample. The mixture was centrifuged (3000rpm/10 minutes/ 4°C) so that the non-polar retinols and β-carotenes partition at the bottom together with the non-polar chloroform and hexane layers. The chloroform and hexane layers were combined and evaporated in inert nitrogen gas so that the retinols and β-carotenes materialised as white solid residues.


Nitrogen evaporator

The solid residues of retinols and β-carotenes were re-dissolved completely in 100uL ethanol and 20uL of this mixture was injected into the RP-HPLC system. 


Parameters
Description
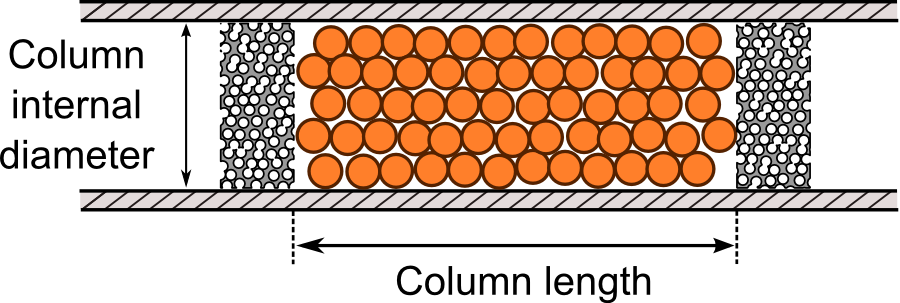
Packed column
150mm length; 4.6mm internal diameter 
particle size about 10um
Stationary phase
C-30 organochlorosilanes coated around silica particles (NON-POLAR)
Mobile phase
100% POLAR ethanol (initially)
Mode of operation
Column left under ambient conditions (without temperature control)

Gradient elution
Composition of mobile phase changes progressively from high [ethanol] to low [ethanol] + high [another non-polar solvent].
Detector
UV-Vis detector (fixed wavelengths)


Stationary phase

Non-polar β-carotenes, retinols and other carotenoids will interact with the non-polar C-30 stationary phase via van der Waal's forces and adsorb strongly against the stationary phase. If a polar stationary phase had been used instead, there would be little or no adsorption. The β-carotenes, retinols and carotenoids would be pushed along the column by the liquid mobile phase and be eluted quickly and very closely together, resulting in poor separation of β-carotenes and retinols.


Packed column in HPLC - stationary phase bonded to silica particles packed tightly in column


Organochlorosilanes are chemically-bonded into silica particles


Why was ethanol used as the liquid mobile phase/solvent?

Polar ethanol has a very weak eluotropic strength against a non-polar stationary phase. Thus at the beginning of the RP-HPLC operation, the non-polar retinols and carotenoids are not desorbed from the stationary phase; they are kept adsorbed onto the stationary phase for as long as possible so that other more polar analytes in the sample are eluted first, much earlier than the carotenoids and retinols. This allows for a clear separation of retinols and carotenoids from other impurities in the sample.


Ethanol does not absorb at 340nm and 450nm and hence will not interfere with the detection of retinols and carotenoids in the serum samples. If ethanol had been able to absorb strongly at such wavelengths, the baseline would be very noisy and the signal-to-noise (S/N) ratio would be low. A real signal for the elution of carotenoids and retinols might be mistaken for part of the background noise and ignored. The HPLC system becomes much less sensitive.


Gradient elution

Initially, 100% polar ethanol with a very weak eluotropic strength was used as the mobile phase. As non-polar β-carotenes, retinols and other carotenoids adsorb strongly against the non-polar stationary phase, eluotropic strength of the mobile phase will have to be strengthened gradually (by adding more of non-polar solvents, such as hexane, and reducing the proportion of polar ethanol) so that the β-carotenes, retinols and other carotenoids can be eventually displaced from the stationary phase. This prevents long analysis times and band broadening.


UV-Vis Photodiodearray detector : Fixed WVL


β-carotenes and carotenoids have extended conjugation and thus absorbs strongly at long wavelengths (450nm). Retinols do not have extended conjugation and thus absorbs strongly at shorter wavelengths (340nm).

The same sample is run twice separately with 20uL each - in the 1st run, the PDA detector is set at 340nm so that only retinol is detected and shows as a peak.

In the 2nd run, the PDA detector is set at 450nm so that only carotenoids (including β-carotenes) are detected. This produces multiple peaks in the chromatogram as there are many different carotenoids in the yellow maize. The peak for β-carotenes is identified by retention time matching.


An external file that holds a picture, illustration, etc.
Object name is ajcn9420510fig2.jpg
Peaks for β-carotenes were identified by retention time matching


Quantification of retinols and β-carotenes in total serum by EXTERNAL STANDARDS

A series of retinol standards of known concentrations were injected separately into the HPLC under the same chromatographic conditions as the serum sample. A calibration graph of area under the curve of retinol peak against concentration of retinol standard was plotted and a regression equation was derived.

Area under curve of retinol peak = m (concentration of retinol std) 


Calculation of:
  • Retinol concentration in 20uL sample
  • Retinol concentration in original 100uL serum sample
  • Amount of retinol in total serum of subject [ 0.0435L x body weight (kg) ]


Quantification of retinols and β-carotene concentration in serum sample by INTERNAL STANDARDS

The internal standard method was used to verify the concentration of retinol and β-carotenes in the 20uL samples. 

Similarly, a series of retinol standards of known concentrations were prepared. A constant volume/concentration of internal standards (retinyl acetate for retinol; echinenone for β-carotene) was added to each of these standards and to the unknown sample.


Because this method uses the ratio of the peak area of the standard to the peak area of the internal standard, the results obtained are more reliable as any drifts in chromatographic conditions between runs would affect both the standards and internal standards equally - keeping the ratio constant throughout.


Retinyl acetate

Retinol


Echinenone
β-carotene


A calibration graph of


         Peak area of STANDARD
------------------------------------------------------      v.s.    Concentration of STANDARD
 Peak area of INTERNAL STANDARD